2. 西南石油大学 地球科学与技术学院, 成都 610500;
3. 中国科学院海西研究院泉州装备制造研究所,福建 泉州 362216;
4. 福州大学 环境与资源学院, 福州 363500;
5. 重庆大学 煤矿灾害动力学与控制国家重点实验室,重庆 400044
2. Schoolof Earth Scienceand Technology, Southwest Petroleum University, Chengdu610500, P. R. China;
3. Quanzhou Equipment Manufacturing Institute, HaixiInstituteof Chinese AcademyofSciences, Quanzhou, Fujian362216, P. R. China;
4. College of Environment and Resources, Fuzhou University, Fuzhou363500, P. R. China;
5. State Key Laboratory ofState Key Laboratory of Coal Mine Disaster Dynamics and Control, Chongqing University, Chongqing 400044, P. R. China
滑坡是自然地质作用和人类活动的影响下, 斜坡上的岩土体在重力作用下向下滑动的现象[1]。滑坡灾害广泛发生于中国大部分地区, 自1950年至2016年, 全国共计发生超过20万起滑坡灾害, 其中1 911起非地震型滑坡造成了28139人死亡[2]。而以四川、重庆为代表的西南地区是中国遭受滑坡灾害最严重的地区, 每年经济受损超过数十亿元[3]。掌握滑坡灾害的空间分布特征、探索滑坡影响因子可以有效预防滑坡灾害的发生和减轻灾害损失。
在滑坡灾害空间分布特征方面, 许多学者通过研究滑坡发生位置与高程、坡度、土地利用等因子空间位置的相对关系, 提出了多种滑坡分布规律研究方法[4-7]; Zhang等[8]通过将历史滑坡点映射在不同尺度行政区上分析了滑坡灾害的空间分布; Sepúlveda等[9]分析了灾害点与地层岩性以及降雨时空分布的关系; Qiu等[10]利用空间点格局分析方法绘制了陕西省滑坡灾害点的空间分布特征图。
在滑坡灾害影响因子探索方面, 上个世纪五十年代便有学者开始研究, 至今共出现了包括启发性、基于物理模型和基于统计学模型等多种方法派别, 衍生出数百种各异的方法[11]。Pawluszek等[12]使用层次分析法对由数字高程模型(DEM)中提取出的因子进行了因子进行贡献值研究; Kavzoglu等[13]利用遗传算法对多达16种影响因子进行了选择并将结果导入逻辑回归进行验证, 结果表示岩性和降雨是最主要的因素; Dou等[14]使用确定性因素模型从滑坡因子数据库种筛选子集并制作滑坡易发性地图; Lin等[2]分析了中国重大滑坡的时空分布并使用地理探测器探索分析得出该研究区内降雨、地形、土壤是最主要的影响因子。
重庆市以“山城”闻名, 其中心城区遍布高陡边坡和不稳定斜坡, 是滑坡和崩塌发生的天然温床。因此, 以重庆市中心城区为研究区, 利用最邻近指数、空间热点探测与核密度估计等原理和方法分析研究区历史滑坡灾害点的空间分布特征, 并建立滑坡影响因子数据库, 使用神经网络模型定量分析各因子贡献值。
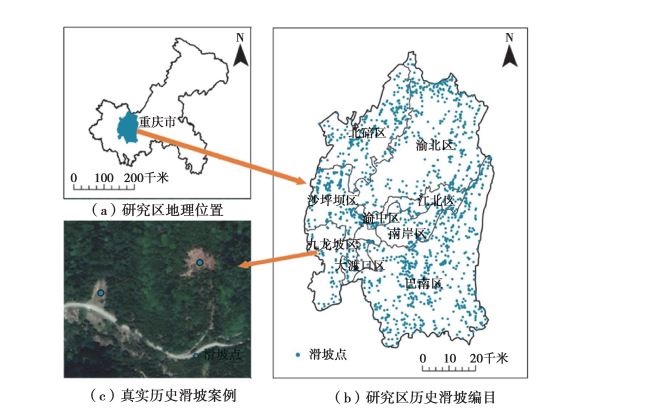
1 研究区概况及滑坡影响因子 1.1 研究区概况研究区为重庆市中心城区, 是重庆市经济最发达、人口最密集的地区, 包括渝中区、江北区、南岸区、九龙坡区、沙坪坝区、大渡口区、北碚区、渝北区、巴南区等9个区, 地理坐标范围106°14' ~106°53'N, 29°12' ~ 30°12'E, 面积5 472.68 km2 (图 1)。
|
注:图(a)和(b)分别基于重庆市规划和自然资源局重庆市标准地图服务网站下载的审图号为渝S(2019)045号和渝S(2019)046号标准地图制作, 底图无修改。 图 1 研究区地理位置及历史滑坡灾害点编目 Fig. 1 Geographical locations and historical landslide disaster points in the study area |
该区位于四川盆地东部边缘, 主要地貌类型为低海拔丘陵和小起伏低山, 大地构造属新华夏系四川沉降区川东褶皱带。研究区内出露的地层主要为中生代侏罗纪和白垩纪砂岩、泥岩。气候属亚热带季风性湿润气候, 年降雨量约1 000~1 350 mm, 主要集中在5~9月。
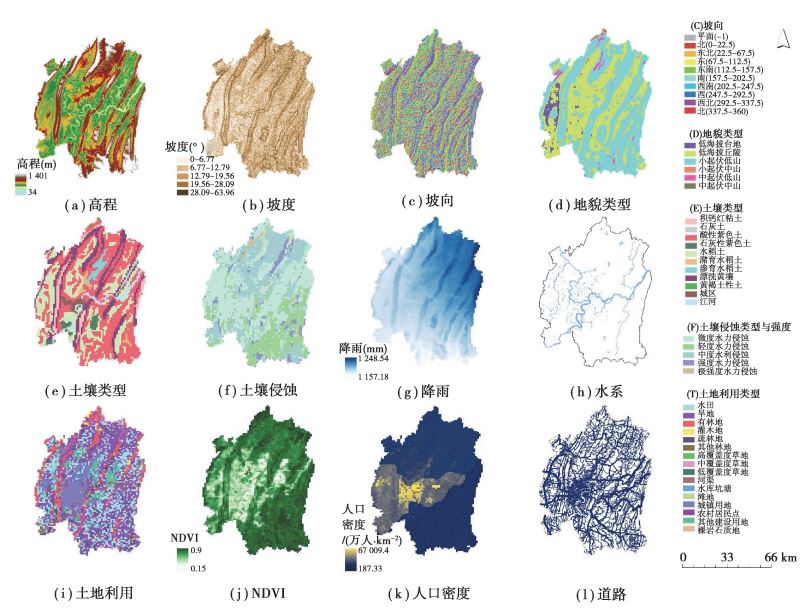
1.2 滑坡影响因子研究区共有1 703个历史滑坡灾害点, 包含滑坡、泥流和崩塌3种形式, 按照Varnes滑坡分类体系统一归类为滑坡灾害(图 1) [1]。滑坡影响因子数据按照Budimir分类法分为5大类共12种因子(图 2), 5大类包括地形地貌、地质、水文、地表覆盖和其他因子(表 1)。12种因子中, 对于连续型因子采用自然断点法分为5级, 对于离散型因子保持其原有分级。
|
注:图(a)和(b)分别基于重庆市规划和自然资源局重庆市标准地图服务网站下载的审图号为渝S(2019)045号和渝S(2019)046号标准地图制作, 底图无修改。 图 2 滑坡影响因子 Fig. 2 Landslide influencing factors |
| 表 1 滑坡影响因子分类与说明 Table 1 Classification and description of landslide influencing factors |
地形地貌因子很大程度上决定了一个地区是否具备滑坡发生的先决条件并被广泛应用于滑坡灾害相关的各类研究中[15-16]。其中, 高程和地貌类型的不同导致了水文条件、植被覆盖和人类工程影响的不同, 而坡度和坡向通过影响斜坡重力作用和水流汇集影响斜坡的稳定性[17]。
通常情况下, 地质条件和地表覆盖控制着一个地区表层土壤的性质以及深部岩土体的物理属性[18]。地震会造成大量的突发性滑坡, 由于研究区内地震烈度相同且较低, 且距离断裂带距离相差不明显, 因此地震烈度与断裂带这个因子没有被添加进数据库。较软弱的土壤会更易失稳, 而较强的土壤侵蚀则会加大这种失稳。植被在一定程度上会加强裸露地表的稳定性从而使表面稳定。
水文条件以及人类活动在许多时间充当了诱发滑坡的关键因素[19-20]。降雨通常被视作导致滑坡的最重要因素, 因为极端降雨后发生滑坡的事件屡见不鲜并且相关研究对此作了证明[21-23]。而人类活动例如道路修建则会直接破坏边坡原有的稳固结构从而导致滑坡或者造成边坡的不稳定加剧。
2 研究方法首先利用空间分布特征分析方法对已知的研究区域的滑坡灾害点进行聚类分析与识别, 以确定哪些是真实的有效的滑坡发生地点, 然后通过滑坡影响因子分析方法来建立上述5类12个影响因子与这些真实有效的滑坡发生点的关系。最后, 通过所发展的模型, 对未知区域的一些潜在的滑坡灾害发生的风险进行有效的评价与验证。
2.1 空间分布特征分析方法在地理空间上可以将滑坡灾害看作点数据, 对于点数据的分布特征有最邻近指数、Ripley’K函数、密度分析等多种空间分析方法。这里选择最邻近指数法探究滑坡灾害点是否具有空间聚集特征, 使用空间热点探测与核密度估计方法定量分析滑坡灾害点在不同地区的聚集程度和空间热点。
2.1.1 最邻近指数分析最邻近指数(nearest neighborindex, NNI), 以INNI表示, 是一种分析地物点空间分布相互邻近程度的指标, 表示方式是平均观测距离与假设随机分布中的邻域间的平均距离的比率[24], 其计算公式为
| $ {I_{\rm NNI}} = \frac{r}{{0.5\sqrt {A/n} }}, $ | (1) |
式中:r为区域内滑坡点的平均距离; n为滑坡点的数量; A为研究区的面积。如果指数小于1, 所表现的模式为聚类; 如果指数大于1, 则所表现的模式趋向于离散或竞争。
2.1.2 空间热点探测空间热点探测旨在寻找区域内某些显著不同于其他地方的区域, 称作异常区, LISA(local indicator of spatial association)是一种常见的空间热点探测指标, 其计算公式为
| $ {I_i} = \frac{{{y_i} - \overline y }}{{{S^2}}}\sum\limits_j^n {{ \mathit{\boldsymbol{w}}_{i, j}}} \left( {{y_i} - \overline y } \right), $ | (2) |
式中:S2为yi的方差; y为均值; wi, j为空间权重矩阵。在本研究中, 将研究区划分为规则公里单元网格, 并计算不同网格内的滑坡点数以此作为空间热点探测的对象。
2.1.3 核密度估计核密度估计(kernel densityestimation, KDE)最早由Rosenblatt提出, 其原理为借助移动单元格对点进行密度估计[25]。后发展成一种探索空间点分布模式的有效手段, 并且其结果具有良好的可视性, 被广泛用于各类事件的空间分布探测中[26-27]。其公式表示为
| $ d{\rm{ }} = \frac{1}{{{r^2}}}\sum\limits_{i = 1}^n {} {\left[ {\frac{3}{\pi }\left( {1 - \frac{{{{\begin{array}{*{20}{l}} {{{(x{\rm{ }} - {x_i})}^2} + (y{\rm{ }} - {y_i})} \end{array}}^2}}}{{{{\begin{array}{*{20}{l}} r \end{array}}^2}}}} \right)} \right]^2}, $ | (3) |
式中:n为点数; r为带宽; (x -xi)2 +(y -yi)2为任意两点间的距离。所使用的带宽计算方法为
| $ r = 0.9{\rm{\cdot}}{\rm{min}}\left( {{D_{{\rm{SD}}}},\sqrt {\frac{1}{{{\rm{ln}}\left( 2 \right)}}} {\rm{\cdot}}{D_{\rm{m}}}} \right){\rm{\cdot}}{n^{ - 0.2}}, $ | (4) |
式中:Dm为加权平均中心的中值距离; DSD为标准距离。
2.2 滑坡影响因子分析方法基于统计学模型(数据驱动)的滑坡影响因子分析方法的原理主要是通过建立历史滑坡与驱动因子的统计回归关系来定量分析影响因子的贡献程度[28]。选用神经网络模型(artificial neural networks, ANNs)作为滑坡影响因子探测识别方法。神经网络模型被应用于滑坡易发性、滑坡危险性和山洪灾害危险性评估等方面并取得了较好的效果[28-32]。
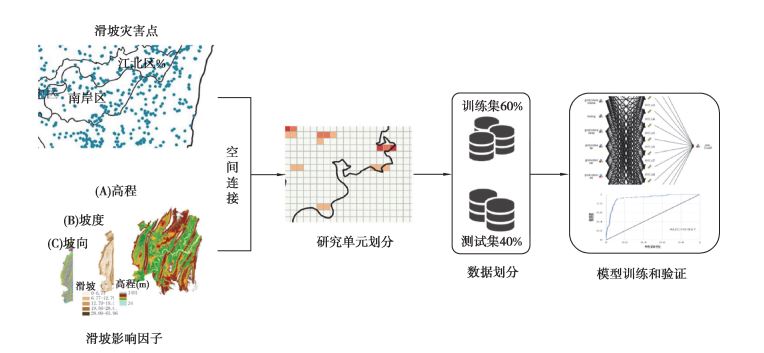
历史滑坡与滑坡驱动因子往往具有复杂的关系, 简单的线性或非线性模型难以有效模拟其关系; 而神经网络可以近似多种预测模型, 且对模型结构和假设只有少量要求, 并能满足目标与预测变量之间的线性与非线性关系。在本研究中, 使用多层感知器(multilayer perceptron, MLP)构建神经网络模型, 基于Weka平台进行了本次实验。滑坡影响因子分析技术路线如图 3所示。
|
图 3 滑坡影响因子分析研究路线 Fig. 3 Researchflow oflandslide influencing factors analysis |
首先, 研究区被划分为500 m×500 m的正方形网格单元, 共计20 898个, 并计算落入网格内的滑坡点数作为神经网络模型中的目标值。与此同时, 通过空间连接分别导入滑坡影响因子数据库中各类因子对应网格的值作为预测变量。然后, 将数据集随机划分为60%的训练集和40%的测试集。最后, 将数据集导入模型, 最终模型输出各变量的重要性以及模型准确性。
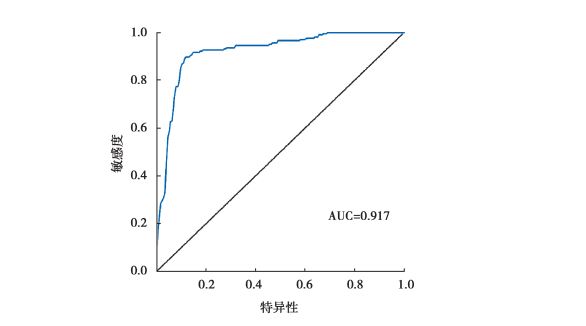
2.3 模型准确度检验为了对上述40%的测试集进行评价, 选择受试者工作特征曲线(receiver operating characteristic, ROC)来评价神经网络模型的准确性, 使用ROC曲线下面积AUC(areaundercurve)值及其置信度来表示ROC的值。ROC曲线是基于敏感性和特异性绘制, 其具有不同的临界阈值, 能定量评估预测准确性[33]。
3 结果与分析 3.1 滑坡灾害空间分布特征最邻近指数使用CrimeStat4计算, 结果显示研究区滑坡灾害点(40%的测试集)平均最邻近指数为0.62, 且通过了0.01置信水平的显著性检验, 说明灾害点在研究区内具有较强的空间聚集趋势。在此基础之上, 使用ArcGIS Pro2.4计算空间热点区域和核密度估计值来展示空间聚集区域与聚集程度。
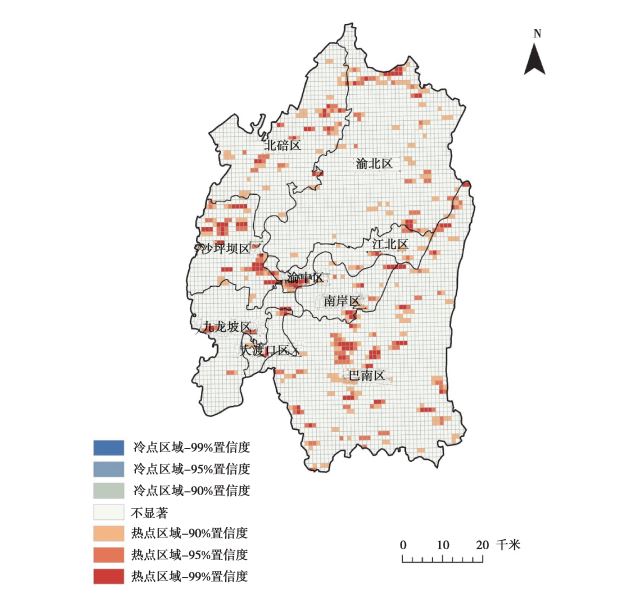
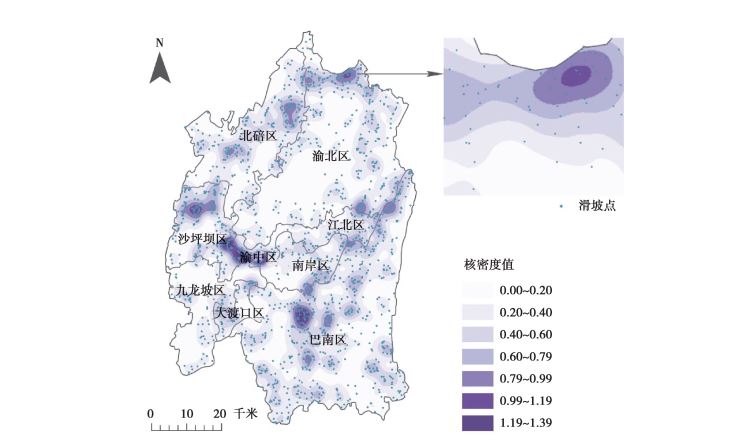
空间热点探测结果(图 4)和核密度估计结果(图 5)具有一致性, 均表示研究区内滑坡灾害点空间分布具有极大的空间聚集性和空间差异性。
|
注:基于重庆市规划和自然资源局重庆市标准地图服务网站下载的审图号为渝S(2019)046号标准地图制作, 底图无修改。 图 4 重庆市中心城区历史滑坡灾害点热点探测图 Fig. 4 Hotspot map of historical landslide disaster pointsin downtown Chongqing |
|
注:注:基于重庆市规划和自然资源局重庆市标准地图服务网站下载的审图号为渝S(2019)046号标准地图制作, 底图无修改。 图 5 重庆市中心城区历史滑坡灾害点核密度估计图 Fig. 5 Kernel densityestimation map of historical landslide disaster pointsin downtown Chongqing |
热点探测结果中, 99%置信度热点区域主要集中于渝中区、沙坪坝区和巴南区北部。表明上述地区中存在连续的多个发生灾害次数较多的单元, 即遭受灾害最为严重的区域。
核密度估计结果最大值出现在最为核心的渝中区, 核密度值达到了1.3以上, 表明该地区滑坡分布最为密集; 沙坪坝区和巴南区出现了数个聚集区域, 并呈现出不规则的分布; 北碚区和渝北区的滑坡分布主要沿东北西南走向的终南山分布, 同时渝北区的大部分地区滑坡分布较少。大渡口区、九龙坡区、南岸区和江北区大部分地区均属于滑坡密度较小的区域。
空间热点探测与核密度估计在结果上表现出较高的一致性, 说明核密度估计的搜索半径合理从而得到较好的核密度估计结果; 同时也表明这两种方法具有相互验证的效果。
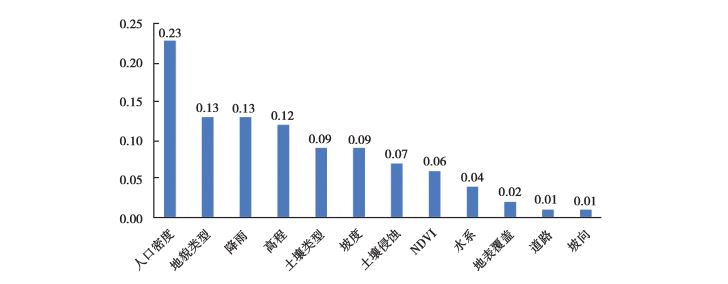
3.2 滑坡灾害影响因子通过对60%的训练数据进行反分析, 对神经网络模型结果进行归一化得到如图 6所示结果, 模型准确性如图 7所示。可以看到ROC曲线下面积AUC值达到0.917, 并且AUC值置信度值报告显示为0.977, 说明该模型具有较高的准确性。
|
图 6 滑坡影响因子权重贡献值(归一化后结果) Fig. 6 Landslide influencing factor weight contribution value (results after normalization) |
|
图 7 神经网络模型ROC值, AUC值(曲线下面积) Fig. 7 The ROC value and AUC value (the area underthecurve) ofneural network model |
滑坡灾害影响因子探测结果显示人口密度是造成重庆市中心城区滑坡灾害空间聚集性和空间差异性的最主要因素。人口密度的大小反映人类工程活动强度的大小, 研究区内高陡边坡极多, 高强度的工程建设和人类活动往往导致边坡的破坏和失稳, 人口密度最大的渝中区在核密度估计结果中显示出了最大的密度值, 在一定程度上也佐证了模型的合理性。
降雨和地貌类型贡献了其次的重要性。事实上绝大多数的滑坡是直接由降雨引发, 但降雨的空间分布差异并非是影响滑坡空间分布特点的最主要因素。其原因是降雨量的大小在空间分布上具有空间自相关性, 即降雨量在研究区的各个地方差异并不显著, 这种差异对滑坡的分布造成的影响也有限。但降雨仍然占据了较高的数值为正的权重, 说明研究区内降雨较多的地区更易发生滑坡灾害, 这与许多研究的结论一致[22, 34]。地貌类型的不同是由于各地区遭受不同的内、外力地质作用, 这样的地质作用也是造成地貌类型的差异对滑坡空间分布差异有较大影响的重要原因。
坡向、道路和地表覆盖类型的作用则相对较小。坡向的作用在不同地区会拥有极为不同的差别, 通常在高大山脉阻隔的地区, 坡向会极大地影响滑坡孕育的条件, 而在北纬30°左右的丘陵和低山地区, 山坡并不会阻隔阳光和暖湿气流, 即坡向并不会很大程度上影响阳光照射、降雨和其他活动。因此在本研究中, 坡向对滑坡空间分布特点呈现出较小的影响。在现实情况中, 道路对滑坡的影响主要为道路的修建对两侧坡体的破坏。研究区内的滑坡并没有呈现出沿道路分布的特点, 而计算结果显示道路并没有较大影响, 这样的结果较为合理。地表覆盖类型在本研究中没有占据较大的权重, 其可能原因是GlobeLand30数据集类型划分过于粗略。
4 结论使用最邻近指数、空间热点探测与核密度估计3种空间分析方法对重庆市中心城区滑坡灾害点进行了空间分布特征分析。最邻近指数结果为0.62, 且显著性较好, 表明重庆市滑坡灾害点具有较强的聚集特征; 空间热点探测与核密度估计结果表明研究区滑坡灾害空间分布具有差异性, 且滑坡聚集程度最高地区位于渝中区, 其次为沙坪坝区和巴南区北部。
使用神经网络模型定量分析了研究区12种滑坡影响因子对滑坡空间分布特点的具体影响, 结果显示:人口密度最大程度的影响了滑坡的分布特点, 降雨和地貌类型其次, 而坡向在本研究区中几乎没有影响。该模型ROC曲线的AUC值为0.917, 表明其精度较高, 能准确反映影响因子对研究区滑坡的控制作用。
本研究中, 空间分布特征分析结果与研究区实际情况相对一致, 且影响因子的驱动作用也得到了较好的定量分析, 以上研究能为滑坡灾害监测预防和后续风险评价提供参考信息。同时本研究依然存在一些不足, 例如研究单元分辨率问题, 主要原因是计算机性能有限, 在提高分辨率时计算量将极大地增加。针对这些不足和局限性, 今后的工作将进行更深入的研究。
致谢
感谢国家科技基础条件平台国家地球系统科学数据中心(http://www.geodata.cn)提供数据支撑; 感谢中国科学院计算机网络信息中心地理空间数据云平台(http://www.gscloud.cn)提供数据支撑。
| [1] |
Hungr O, Leroueil S, Picarelli L. The Varnes classification of landslide types, an update[J]. Landslides, 2014, 11(2): 167-194. |
| [2] |
Lin Q G, Wang Y. Spatial and temporal analysis of a fatal landslide inventoryin China from 1950 to 2016[J]. Landslides, 2018, 15(12): 2357-2372. DOI:10.1007/s10346-018-1037-6 |
| [3] |
Ba Q Q, Chen Y M, Deng S S, et al. A comparison of slope units and grid cells as mapping units for landslide susceptibility assessment[J]. Earth Science Informatics, 2018, 11(3): 373-388. DOI:10.1007/s12145-018-0335-9 |
| [4] |
Rosi A, Tofani V, Tanteri L, et al. The new landslide inventory of Tuscany (Italy) updated with PS-InSAR:geomorphological features andlandslide distribution[J]. Landslides, 2018, 15(1): 5-19. DOI:10.1007/s10346-017-0861-4 |
| [5] |
Keefer D K. Statistical analysis of an earthquake-induced landslide distribution: the 1989 Loma Prieta, California event[J]. Engineering Geology, 2000, 58(3/4): 231-249. |
| [6] |
Pardeshi S D, Autade S E, Pardeshi S S. Landslide hazard assessment: recenttrends and techniques[J]. SpringerPlus, 2013, 2: 523. DOI:10.1186/2193-1801-2-523 |
| [7] |
Bucci F, Santangelo M, Cardinali M, et al. Landslide distribution and sizein responseto Quaternaryfault activity: the Peloritani Range, NE Sicily, Italy[J]. Earth Surface Processes and Landforms, 2016, 41(5): 711-720. DOI:10.1002/esp.3898 |
| [8] |
Zhang F Y, Huang X W. Trend and spatiotemporal distribution of fatal landslides triggered by non-seismic effects in China[J]. Landslides, 2018, 15(8): 1663-1674. DOI:10.1007/s10346-018-1007-z |
| [9] |
Sepúlveda S A, Petley D N. Regional trends and controlling factors of fatal landslides in Latin America and the Caribbean[J]. Natural Hazards and Earth System Sciences, 2015, 15(8): 1821-1833. DOI:10.5194/nhess-15-1821-2015 |
| [10] |
Qiu H J, Cui Y F, Yang D D, et al. Spatiotemporal distribution of nonseismic landslides during thelast 22 years in Shaanxi Province, China[J]. ISPRS International Journal of Geo-Information, 2019, 8(11): 505. DOI:10.3390/ijgi8110505 |
| [11] |
Reichenbach P, Rossi M, Malamud B D, et al. Areview of statistically-basedlandslide susceptibility models[J]. EarthScience Reviews, 2018, 180: 60-91. |
| [12] |
Pawluszek K, Borkowski A. Impact of DEM-derived factors and analytical hierarchy process onlandslide susceptibility mapping in the region of Roz·nów Lake, Poland[J]. Natural Hazards, 2017, 86(2): 919-952. DOI:10.1007/s11069-016-2725-y |
| [13] |
Kavzoglu T, Kutlug Sahin E, Colkesen I. Selecting optimal conditioning factors in shallow translational landslide susceptibility mapping using geneticalgorithm[J]. Engineering Geology, 2015, 192: 101-112. DOI:10.1016/j.enggeo.2015.04.004 |
| [14] |
Dou J, Tien Bui D, Yunus A P, et al. Optimization of causative factors for landslide susceptibility evaluation using remote sensingand GIS datain parts of Niigata, Japan[J]. PLoS One, 2015, 10(7): e0133262. |
| [15] |
Fabbri A G, Chung C J F, Cendrero A, et al. Is prediction of future landslides possible with a GIS?[J]. Natural Hazards, 2003, 30(3): 487-503. DOI:10.1023/B:NHAZ.0000007282.62071.75 |
| [16] |
Awawdeh M M, ElMughrabi M A, Atallah M Y, et al. Spatial heterogeneity of estuarine wetland ecosystem health influenced by complex natural and anthropogenic factors[J]. Environmental Earth Sciences, 2018, 634(1445): 1462. |
| [17] |
Chi Y, Zheng W, Shi H H, et al. Improving predictive power of physically based rainfall-induced shallow landslide models: a probabilistic approach[J]. Geoscientific Model Development Discussions, 2013, 6(1426): 1-1367. |
| [18] |
Raia S, Alvioli M, Rossi M, et al. Improving predictive power of physically based rainfall-induced shallow landslide models: a probabilistic approach[J]. Catena, 2016, 145: 164-179. DOI:10.1016/j.catena.2016.06.004 |
| [19] |
Tsangaratos P, Ilia I, et al. Comparison of a logistic regression and Na?ve Bayes classifier in landslide susceptibility assessments: The influence of models complexity and training datasetsize[J]. Catena, 1999, 30(1/2): 25-32. |
| [20] |
van Asch T, Buma J, van Beek L. A view on some hydrological triggering systems in landslides[J]. Geomorphology, 1999, 30(1/2): 25-32. |
| [21] |
Xu Y, Xu X R, Tang Q. Human activity intensity of land surface: Concept, methods and application in China[J]. Journal of Geographical Sciences, 2016, 26(9): 1349-1361. DOI:10.1007/s11442-016-1331-y |
| [22] |
Tien Bui D, Ho T C, Pradhan B, et al. GIS-based modeling of rainfall-induced landslides using data mining-based functional trees classifier with AdaBoost, Bagging, and MultiBoost ensemble frameworks[J]. Environmental Earth Sciences, 2016, 75(14): 1101. DOI:10.1007/s12665-016-5919-4 |
| [23] |
Piciullo L, Calvello M, Cepeda J M. Territorial early warning systems for rainfall-inducedlandslides[J]. Earth-Science Reviews, 2018, 179: 228-247. DOI:10.1016/j.earscirev.2018.02.013 |
| [24] |
Shafabakhsh G A, Famili A, Bahadori M S. GIS-based spatial analysis of urban traffic accidents: Case studyin Mashhad, Iran[J]. Journal of Trafficand Transportation Engineering (English Edition), 2017, 4(3): 290-299. DOI:10.1016/j.jtte.2017.05.005 |
| [25] |
Davis R A, Lii K S, Politis D N. Remarks on some nonparametric estimates of a density function[M]∥Selected Works of Murray Rosenblatt. New York, NY: Springer New York, 2011: 95-100.
|
| [26] |
Harirforoush H, Bellalite L. A new integrated GIS-based analysis to detect hotspots: a case study of the City of Sherbrooke[J]. Accident Analysis and Prevention, 2019, 130: 62-74. DOI:10.1016/j.aap.2016.08.015 |
| [27] |
Hashimoto S, Yoshiki S, Saeki R. Developmentand application oftraffic accident densityestimation models using kernel density estimation[J]. Journal of Traffic and Transportation Engineering (English Edition), 2016, 3(3): 262-270. DOI:10.1016/j.jtte.2016.01.005 |
| [28] |
Poudyal C P, Chang C D, Oh H J, et al. Landslide susceptibility maps comparing frequency ratio and artificial neural networks: a case study from the Nepal Himalaya[J]. Environmental Earth Sciences, 2010, 61(5): 1049-1064. DOI:10.1007/s12665-009-0426-5 |
| [29] |
Abbaszadeh Shahri A, Spross J, Johansson F, et al. Landslide susceptibility hazard map in southwest Sweden using artificial neural network[J]. Catena, 2019, 183: 104225. DOI:10.1016/j.catena.2019.104225 |
| [30] |
Yilmaz I. A case studyfrom Koyulhisar (Sivas-Turkey) forlandslide susceptibility mapping by artificial neural networks[J]. Bulletinof Engineering Geologyandthe Environment, 2009, 68(3): 297-306. DOI:10.1007/s10064-009-0185-2 |
| [31] |
Harmouzi H, Nefeslioglu H A, Rouai M, et al. Landslide susceptibility mapping of the Mediterranean coastal zone of Morocco between Oued Laouand El Jebha using artificial neural networks (ANN)[J]. Arabian Journal of Geosciences, 2019, 12(22): 696. DOI:10.1007/s12517-019-4892-0 |
| [32] |
de Oliveira G G, Ruiz L F C, Guasselli L A. Random forest and artificial neural networks inlandslide susceptibility modeling: a case study of the Fão River Basin, Southern Brazil[J]. Natural Hazards, 2019, 99(2): 1049-1073. DOI:10.1007/s11069-019-03795-x |
| [33] |
Pourghasemi H R, Rahmati O. Prediction of the landslide susceptibility: Which algorithm, which precision?[J]. Catena, 2018, 162: 177-192. DOI:10.1016/j.catena.2017.11.022 |
| [34] |
Do uJ, Yunus A P, Tien Bui D. Evaluating GIS-based multiple statistical models and data mining for earthquake and rainfall-induced landslide susceptibility usingthe LiDAR DEM[J]. Remote Sensing, 2019, 11(6): 638. DOI:10.3390/rs11060638 |
 2020, Vol. 43


